PrymFX Forex Newsletter - October 13th, 2020
- PrymFX Team
- Oct 13, 2020
- 3 min read

Updated: Nov 4, 2020
Wild week it has been. Despite our Risk oscillators being in Overbought territory the market risk markets continue to increase. We have noted before that our oscillators can remain in overbought and oversold territory strong risk trends one way or the other. This is clearly one of those cases.
At this point the risk market has been holding up very well and it has affected instruments across the board, from stocks to the U.S. Dollar, Gold and the cross currencies. Let's look at some charts to see where we are, and where we thing we may be headed.
DXY

As noted last week, the DXY has resolved the falling-wedge to the upside. The DXY is a proxy for risk, as it falls when risk assets increase and rises as risk assets decrease. As such we are expecting for the risk markets to begin to fade over the next several days as the DXY moves above the 94.00 level. This bodes well for lower prices in the JPY crosses such as AUD/JPY, NZD/JPY and CAD/JPY.
S&P 500
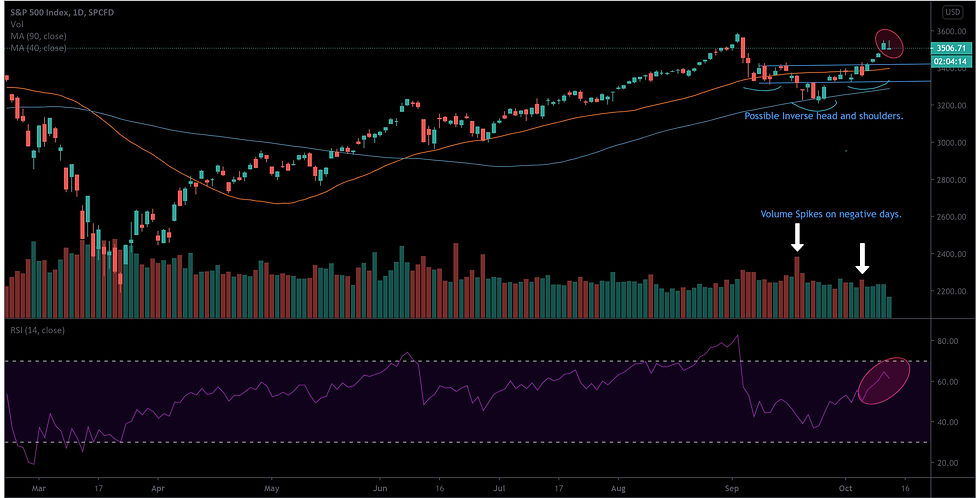
The S&P 500 looks like it is headed to all time highs off an inverted head and shoulders pattern. However, as traders we need to be very careful as this could easily turn into a double top pattern on a longer-timeframe, especially with all the uncertainties on the horizon. Note an inverted hammer in today's session and the RSI beginning to turn south. This is a sign of caution for the overall equities and risk markets. As such, traders should be cautious in both directions with JPY crosses.
EUR/USD

The Euro briefly crossed above the descending trendline shown above, but was quickly rejected by our short-term moving average line. We expect this pair to remain rangebound and return below the descending trendline until we have further resolution on Brexit, U.S. Elections and the direction if the U.S. Dollar. Expect rangebound movement for the next several days and weeks.
AUD/JPY

As we have noted above, JPY cross trade very much in line with risk. This pair is suffering from two things: 1. Overstretched Conditions and 2. A Dovish RBA. We are watching carefully as the RSI has turned decidedly lower and we are retesting the upper band of the previous channel. We are looking for this pair to return into the channel and trade sideways until we have more clarity in markets in general.
NZD/USD

The KIWI above, looks like it has hit the rising channel as resistance rom the break a couple of weeks ago. It has also been met with resistance by our short-term moving average. RSI is looking to go below 50 as a bearish sign. Like many other instruments, this is going to be greatly affect in the short-term by the moves in the U.S. Dollar and general risk appetite. We expect the former to move up and the latter to move down during the next three weeks. As such, we are looking a bearish resumption in this pair.
USD/CAD

The USD/CAD pair is generally affiliated with two things: the DXY and OIL. Although oil is currently trying to break the $40 dollar barrier, it is looking a stronger dollar will provide a headwind for that to happen. As a result, we expect this to stay above the descending line and move up as soo as the RSI gets close to or above 50.
GBP/USD

Finally we have reached Stirling. There is really only one thing that determines how this pair will move in the near future: BREXIT. As the negotiations have stalled it has dropped down into support as show above by the rising trend line. Eventually we expect a resolution above the 1.30 level followed by a breakout to the upside. However, timing is gonna be tough as we don't know exactly how or when the BREXIT negotiations are going to end. Should trade sideways but we will be looking to get long on a strong move above 1.3000.
Have a great night, thank you for reading and happy trading.


Comments